
As Safer-at-Home orders came into effect across the country, many people shifted their day-to-day behavior in unexpected ways. In addition to empty restaurants, open streets, and vacant public spaces, wastewater also gives us great insight into these behavioral changes. Luckily, we don’t have to look at the actual wastewater—just wastewater flow data. I reached out to some clients and colleagues and gathered real-life data to see just how things have changed.
What does “normal” look like?
All the water we use in our homes or businesses drains into a local collection system and eventually ends up at a wastewater treatment plant (WWTP). For most people, that’s all they need or want to know about wastewater. However, when we look a bit deeper into the data, we can learn some very interesting information about our communities.
The amount of wastewater coming into a WWTP is measured with a flow meter. As you may suspect, flow to the WWTP is not constant—it fluctuates throughout each day—but it does have a fairly predictable pattern, called a diurnal curve. When examining flows within a residential area, wastewater flows rise in the morning as people get out of bed and use the restroom, shower, make breakfast and get ready for their day. After the morning rush, flows decrease until people start returning home to make dinner, clean dishes, and shower as they get ready for bed.
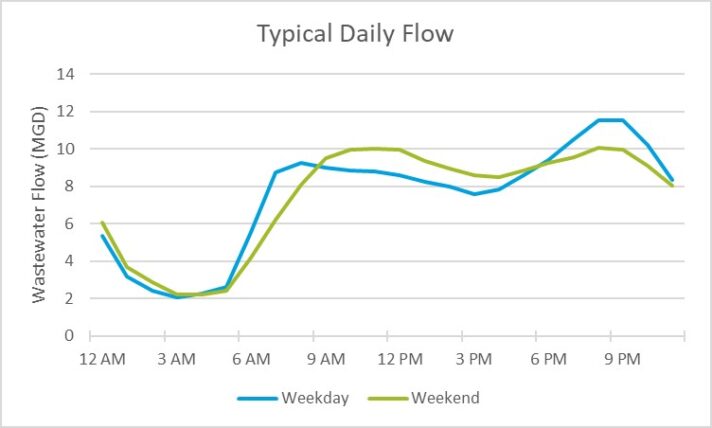
Wastewater flows are such a good indicator of activity that we can also see differences in weekdays and weekends. People generally sleep in on weekends, so the first peak of flows comes later in the morning. With more people home during the day, the flow stays higher, and more people go out to dinner, so the evening peak flow is not as large.
Safer-at-Home
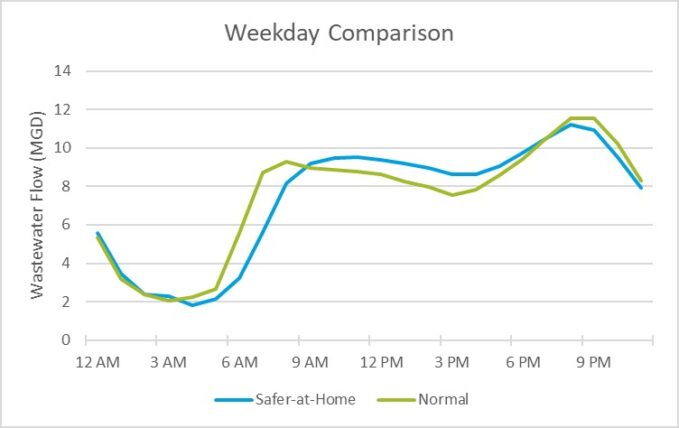
Beginning in March 2020, local and state governments started issuing official Safer-at-Home orders. The figure below shows weekday wastewater flows in a residential area the first week of March versus the last week of March. As people stopped commuting to work, they started sleeping in more, and the peak of morning flows shifted later. Weekday flows began to look like weekend flows, but the evening peak remained as people had to eat at home.
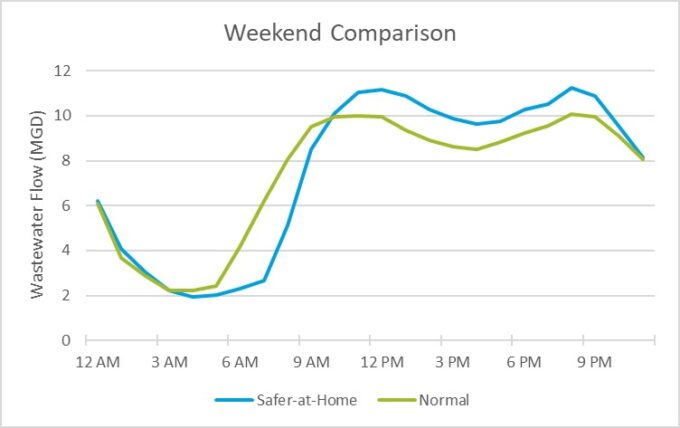
There was also a shift in weekend flows from the first week to the last week of March. The morning peak moved later than usual; flows are higher throughout the day since people are stuck at home; and the evening peak is similar to a typical weekday as people can’t go out for dinner.
Toilet paper shortage
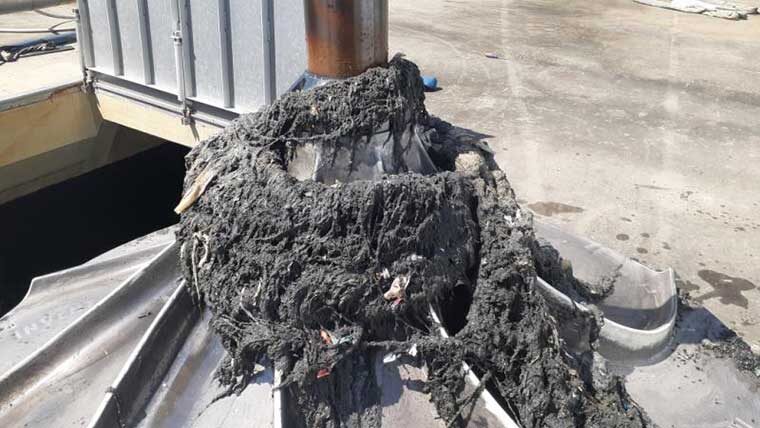
One thing all the clients I’ve talked to mentioned (and that social media outlets have brought a lot of attention to) is the toilet paper shortage. As toilet paper ran out, people started resorting to all sorts of alternatives, which then led to the flushing of said alternatives down the toilet. This has put a real strain on wastewater collection systems. Toilet paper is made to break down, and is easily processed. Nothing else—not even “flushable” wipes—should be sent down any drain.
Clients are getting creative when it comes to correcting this issue. This video from Hillsborough County, Florida reminds customers what they should and shouldn’t flush, and is surprisingly catchy. This behavioral shift will hopefully correct itself as the public becomes more aware.
We can learn a lot about how our communities function day-to-day through observing wastewater flows. We can also learn a lot about how our communities function in crisis situations. If we look carefully, we can learn how to better prepare our wastewater facilities for multiple eventualities in the future.