In transportation planning, we typically design for demand. To me this reads as “design for the world we live in” rather than the world we want to see. Recently, I had the opportunity to lead a project based around transportation equity. Entitled “Baltimore City Transportation Equity Gap Analysis”, the project’s purpose was to identify the ways in which public transportation was not meeting the needs of underserved populations in Baltimore. The goal was to then recommend improvements that would fill the “gaps” in service, better enabling residents who live in areas that have poor economic outcomes get to work.
As a first-time project manager, I jumped at the chance to channel my frustrations with status-quo demand planning into a new paradigm. Together, my team and I developed the following analytical framework for designing transportation systems for equity:
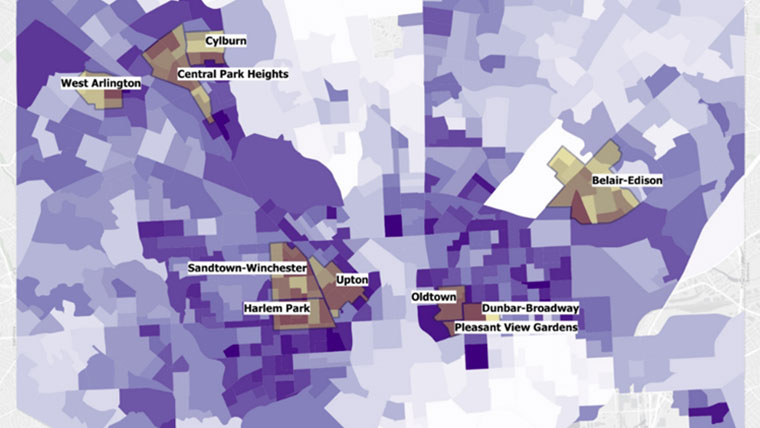
Step 1: Identify who you’re planning for and where they live.
Since my project was specifically geared towards transportation to jobs and economic outcomes, we envisioned our target population as people who are the least advantaged in the job market and are struggling to make ends meet. These might be people who don’t have advanced degrees, don’t own cars/rely exclusively on public transit for commuting, are unemployed, and live at or below the poverty line, coupled with the standard indicators of inequity like race and disability status. We located the highest concentrations of our target population using spatial demographic information from the American Community Survey. We then chose priority communities based on a combination of our data indicators and the Baltimore City Department of Transportation’s existing relationships with neighborhood associations and community leaders.
Step 2: Identify where your population wants to go.
The standard practice in employment center identification is to find the areas with the highest concentration of jobs. We don’t consider whether those jobs are attainable for people who need employment or whether they provide suitable wages and benefits to support the needs of families. To better customize employment destinations for our target population, we mapped LODES origin-destination data for our priority locations as well as jobs that provide a livable wage, defined for Baltimore City as $15/hour or more, and don’t require advanced degrees. Together, these two data sets combine to create an employment center heat map tailored to the needs of our target population.
Step 3: Identify when your population wants to go.
Many public transit systems are designed for 9-to-5 jobs, even though this time frame only represents a subset of workers. Some examples of non-peak hour jobs are health care workers, librarians, maintenance staff, fitness instructors, and retail employees. Not only do people need to be able to get to their jobs reliably, but they also need to be able to get home after their shift. Transit sheds from priority locations should be analyzed to determine if there are any time or day gaps in service to the jobs identified in the previous step. We defined a reasonable transit shed as up to a 45-minute commute (preferably under 30 minutes), 1/4th mile walking distance at each end, and a maximum of one transfer.
Step 4: Connect the dots.
Using the employment data developed in Step 2 and the gaps identified in Step 3:
- Create modifications to existing transit routes that fill gaps.
- Propose new transit lines that directly connect communities to areas of opportunity.
- If there are no clear patterns, or if patterns are spread out but within relatively contained areas, an on-demand shuttle service may be appropriate.
- Make accessibility improvements, like fixing a sidewalk, installing a crosswalk, or creating better wayfinding.
Since employment data is a snapshot in time and does not capture work hours, this framework is meant to be a starting point. Communities should always heavily inform the systems designed to serve them. This is particularly crucial for transportation systems. If you plan for intensive community engagement, people will give you information that you can’t find in data. In addition to more accurate employment data, this could also be circumstantial data like feeling unsafe when walking to the bus stop due to inadequate lighting or having trouble finding schedules. Conversations with communities should be open and continuous. No matter how clever the analysis, a transportation system that people don’t use is a failed project.
I am heartened at the reckoning this country seems to be having on the subject of systemic racism. It’s high time that we take the color- and class-blindness out of transportation planning and lift up the communities that are falling through the cracks.